A skewed distribution is an asymmetrical distribution where the data points cluster more towards one side of the scale. That is, the two tails of the graph, the left, and the right have different lengths. Either of the tail must be longer than the other. Symmetrical distributions have their one-half distribution on one side and their mirror image on the other side. A normal distribution is a symmetrical distribution with the same tail shape. As skewed distribution has different shapes for the tails, it is asymmetric.
What is Skewness?
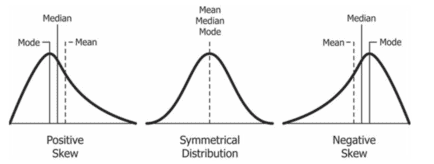
Skewness is the measure of asymmetry or distortion to the symmetric bell-shaped graph in a set of data. It is the extent to which the distribution varies from a normal distribution. A distribution is said to be skewed if the curve shifts to right or left from a normal bell-shaped distribution.
The symmetrical curve has zero skewness. That is the normal distribution has a skew of zero.
A skewed distribution has a tail at either of the sides. A tail refers to the tapering off on one side of the graph. If the curve has a tail in the positive direction, it is said to have positive skew and the long tail is in the negative direction, the curve is said to have a negative skew. There can also be an undefined skew.
The formula used to find the skewness is:
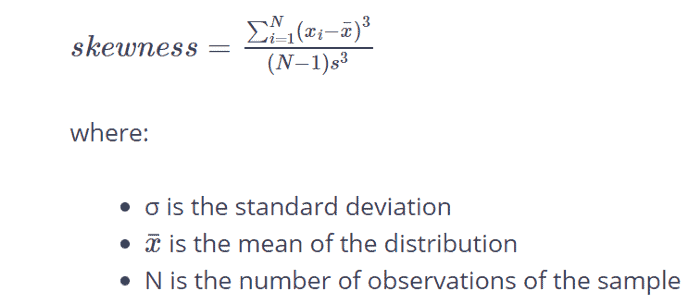
If the value of the skewness is positive, it corresponds to a positively skewed distribution, whereas if the value is negative, it corresponds to a negatively skewed distribution.
Positive skewness is the result of a lower boundary in a dataset while negative skewness is due to a higher upper boundary. Also, skewness in data set causes due to start-up effects. If we are to take an example, if a company has a huge profit in the initial period of their business, it leads to a positive skewness and if it has a huge loss in the initial period, it leads to a negative skew.
Most of the real-life distributions are skewed. However, simple statistical techniques might not work if skewness is present in excess. Hence more advanced mathematical techniques like logarithms are used in real-life scenarios.
Mean and Median in Skewed Distribution
As we all know, the mean is the average value of the distribution. In a normal distribution, it is the point at the center of the graph.
Mean can be calculated by adding the elements and dividing it by the total number of elements.
Median refers to the middle element in a dataset when it is arranged in ascending order. If there is an even number of elements, the median is the average of the two elements in the middle.
The mode is the most frequently appearing element.
In a normal distribution, the mean and median are the same number. But in a skewed distribution, they correspond to different values. We will have a look at how the mean, median, mode differ in respect to skewness of the distribution later below.
Right Skewed Distribution or Positively Skewed Distribution
A right-skewed distribution has a tail at the right of the number line. It is also called the positively skewed distribution as its long tail extends to the positive side of the number line. A positively skewed distribution is a distribution in which the elements are clustered around the lower side of the scale.
There is a misconception that the right-skewed distribution has its peak that tends to the right of the number line. This is inaccurate. In determining skewness, we have to look at the tail of the curve and not the peak of the curve for drawing an accurate conclusion. Skew is a representation of where the tail of the graph is and not the position of data points. A right-skewed distribution has a tail at the right side of the curve and a peak leaning to the left.
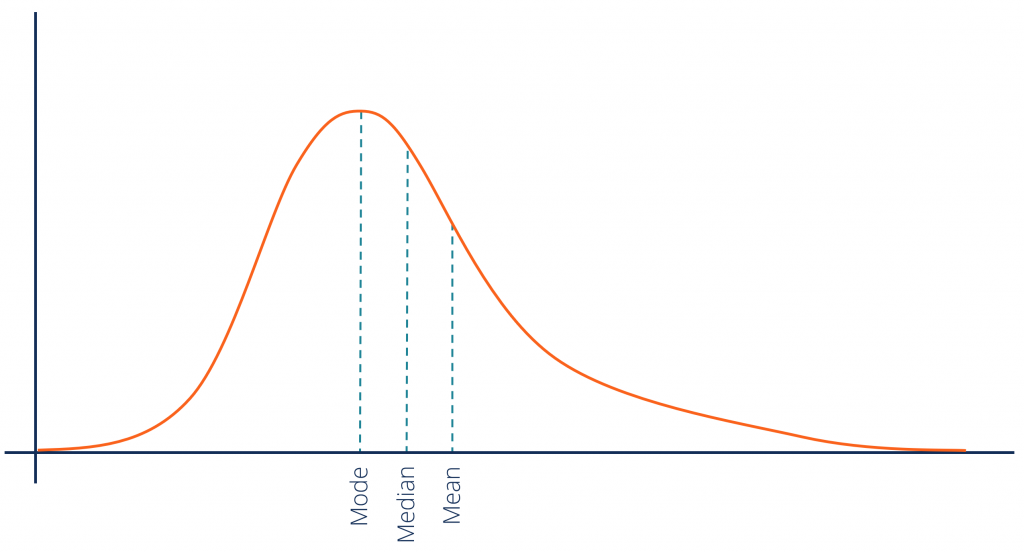
Right Skewed Distribution Graph
A right-skewed distribution has:
- The mean value to the right of the peak.
- A longer tail on the right side.
- Mean value to the right of the median value in general. However, there are cases that violate this rule.
A positively skewed distribution occurs more commonly in real life. The income of people in an area can be taken as an example. The people who earn a low to average income will form the majority whereas people who earn a really high income will be in the minority. As there cant be the occurrence of a negative value for income, the negative tail ends at zero while the positive tail tampers off as there might be people with huge income and one cannot estimate a maximum value for it.
Right Skewed Mean and Median
In a right-skewed distribution, the mean is to the right of the median. Generally, in a positively skewed distribution, the mean is often the largest, and mode is the smallest. Median will be often greater than the mode but less than the mean. This is called the rule of thumb. That is, the rule of thumb for a right-skewed distribution is Mean > Median > Mode (Although there are exceptions to this rule in certain cases that involve theoretical mathematics. Hence, this is not an absolute fact)
Let us take an example.
The given dataset is: 6, 7, 7, 7, 7, 8, 8, 8, 9, 10
Median = 7.5
Mean = 7.7
Mode= 7
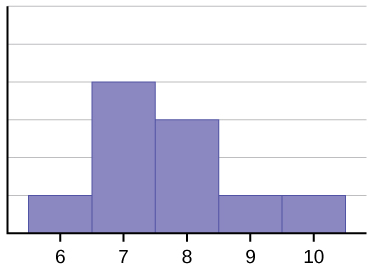
As you can see, the curve is skewed to the right.
Right Skewed Distribution Histogram
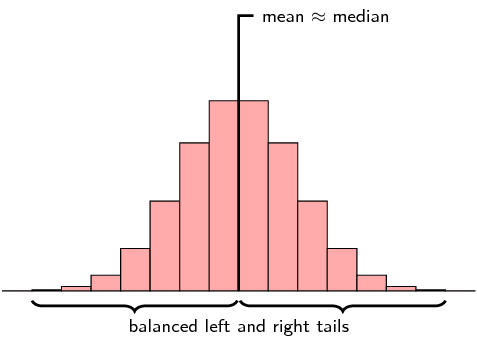
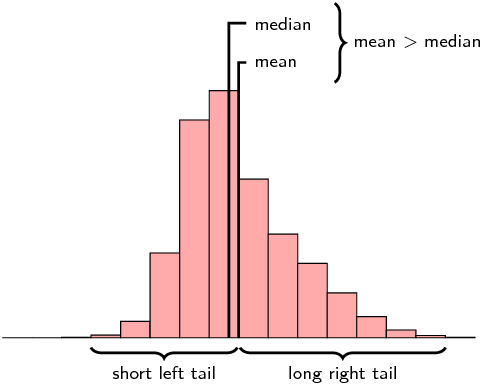
A histogram is a common way to graphically visualize the data in statistics using bars of different heights. A right-skewed distribution has a histogram with a gradual tapering of bars on the right and a peak drawn to the left. Let us take a look below at how a symmetric histogram differs from a right skewed histogram
Right Skewed Distribution Box Plot
A box plot, also known as whisker & box plot is a graphical representation of data in statistics that tells about the range of data, its variability, and center. Skewed data can be represented by box plots.
A box plot consists of a horizontal line that is drawn according to the scale, and a box that is stretched from the minimum quartile value, which is calculated from the range of the dataset to the maximum value of the data set, with a vertical line cutting through the box depicting the median.
Box plot is particularly useful in determining the symmetry of the dataset. The box plot of the symmetric dataset has the median cutting the box in the box plot at the center, dividing it into two equal boxes. Whereas for a skewed distribution has a box plot with the median dividing it into two unequal boxes. If the box on the right side is longer, then it indicates that it is positively skewed. Let us have a look at the symmetric box plot vs a right-skewed box plot
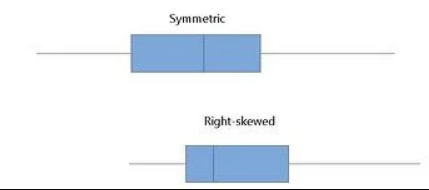
A right-skewed box plot has a slightly longer box on the right side. It can also be interpreted as the median of the box plot tends to draw on the left side.
It is important to note that the longer size of one side of the box plot does not mean that it is the side where more sample data is occurring. The size of the sample data is based on its percentage. Each section of the box plot contains 25% sample data no matter what. The longer side only indicates that it is the section where the sample data has a wider range. The smaller section is where the data are seen clustered together.
Even though the box plot indicates the symmetry of the data, it does not tell the shape of the symmetry. A histogram is used for this. In fact, two different symmetric distributions with different shapes could have the same box plot. Box plot is more used to interpret the variability of the data set.
Left Skewed Distribution or Negatively Skewed Distribution
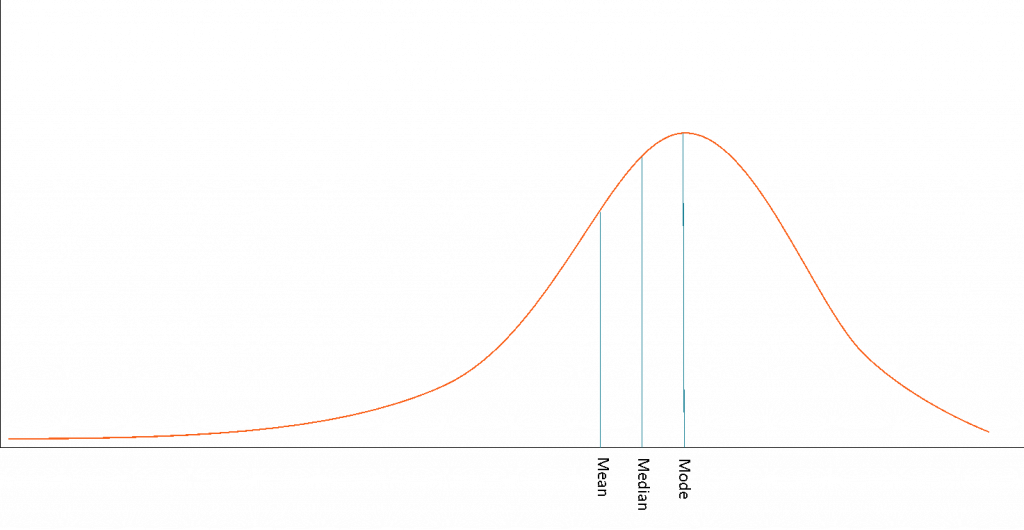
A left-skewed distribution has a tail at the left of the number line. It is also called the negatively skewed distribution as it has a long tail at the left end, extending to the negative direction of the number line. As the tail is on the left end, its peak will be drawn to the right.
Left Skewed Distribution Graph
A left-skewed distribution graph has:
- The mean value to the left of the peak
- A longer tail on the left side
- The mean value to the left of the median in general, although not absolute in all the cases.
An example of a left-skewed distribution can be the marks of the students in a relatively easy exam. Here there exists an upper limit for the scores obtained by the students. As the majority of the students find the exam easy, they would score good marks. But there would still be students who also scored very low marks that extend to zero, perhaps even negative if there is negative marking for the test. Hence it is a negatively skewed distribution.
Left Skewed Mean and Median
For the negatively skewed distribution, the mean lies on the left side of the median. In this case, the mode value is generally the highest value and mean the lowest value with a median value greater than the mean and less than the mode. That is, the rule of thumb for a left-skewed distribution is Mean < Median < Mode. (There are exceptions in here as well and this is not an absolute fact in here either.)
For example, if a data set is given as 4, 5, 6, 6, 6, 7, 7, 7, 7, 8
Median= 6.5
Mean= 6.3
Mode= 7
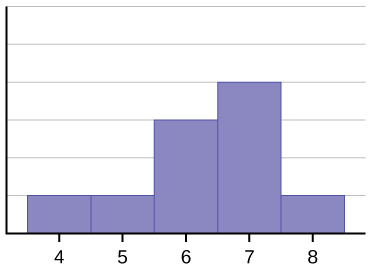
As it is seen, the graph is negatively skewed with a tail at the left side.
Left Skewed Distribution Histogram
A left-skewed histogram has a gradual tapering of graphical bars on the left end. Histograms are particularly useful to know the symmetric or asymmetric shape of the graphs. Let us compare how a symmetric histogram differs to a left-skewed histrogram
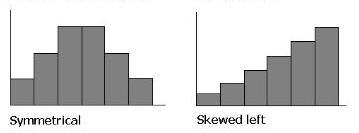
As it is seen, the histogram has a long tail in the left end.
Left Skewed Distribution Box Plot
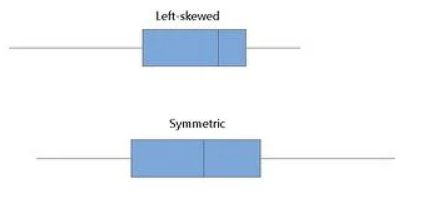
A boxplot of the left-skewed distribution has a median line that cuts the box into two unequal halves, with the left box longer than the right. The formulas used for calculating and plotting for the negatively skewed box plot is the same as that of the positively skewed distribution. Here too, the longer left box does not indicate the increased number of sample data but the wider range of it.
Differences between Symmetric vs Right-Skewed vs Left-Skewed Distribution
| Symmetric Distribution | Right Skewed Distribution | Left Skewed Distribution |
| It has a graph whose one half mirrors the other, with the same tail length on each end. | It has a longer tail in the right end, extending to the positive number line. | It has a longer tail in the left end, extending to the negative number line. |
| It has its peak in the center of the graph. | It has its peak drawn left to the center. | It has its peak drawn to the right of the center. |
| The mean, median, and mode value is identical. | The mean, median, and mode have different values, with a general thumb rule: Mean > Median > Mode | The mean, median, and mode have different values, with a general thumb rule: Mean < Median < Mode |
| The mean value is at the peak of the graph | The mean value is to the right of the peak of the graph. | The mean value is to the left of the peak of the graph. |